
Weak New Listings Slow Canadian Home Sales as Prices Continue to Rise.

Sellers Housing Market Now in the Greater Toronto Area (GTA)
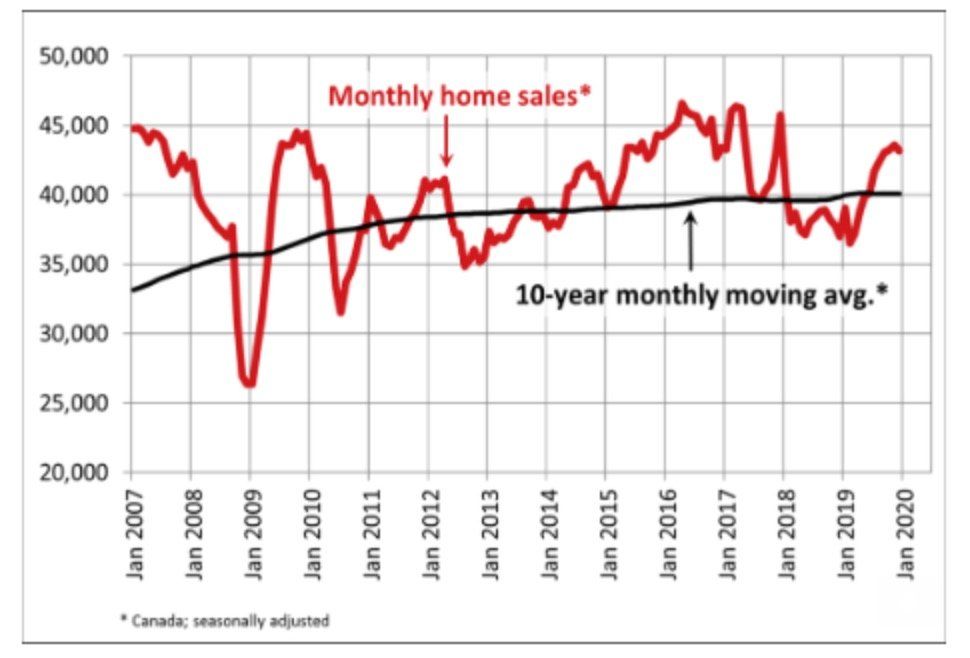
Statistics released today by the Canadian Real Estate Association (CREA) show that national existing-home sales dipped between November and December owing to a dearth of new listings, especially in the GTA.National home sales edged down 0.9% in the final month of 2019, ending a streak of monthly gains that began last March. Activity is now about 18% above the six-year low reached in February 2019 but ends the year about 7% below the peak recorded in 2016 and 2017 (see chart below).
There was an almost even split between the number of local markets where activity rose and those where it declined, with higher sales in the Lower Mainland of British Columbia, Calgary and Montreal offsetting declines in the Greater Toronto Area (GTA) and Ottawa.
Actual (not seasonally adjusted) activity was up 22.7% compared to the quiet month of December in 2018. Transactions surpassed year-ago levels across most of Canada, including all of the largest urban markets.
The December decline in home sales is not a sign of weakness but is instead the result of diminishing supply. Excess demand continues to push up prices in most regions of Canada. Demand has been boosted by low interest rates, strong population growth and strong labour markets that have triggered significant gains in household incomes. Mitigating this, in part, is the mortgage stress-test, which continues to sideline some potential buyers.
According to Gregory Klump, CREA's Chief Economist, "The momentum for home price gains picked up as last year came to a close. If the recent past is prelude, then price trends in British Columbia, the GTA, Ottawa and Montreal look set to lift the national result this year, despite the continuation of a weak pricing environment among housing markets across the Prairie region."
New Listings
The number of newly listed homes slid a further 1.8% in December following a 2.7% decline the month before, leaving supply close to its lowest level in a decade.
Slightly higher sales and a drop in new listings further tightened the national sales-to-new listings ratio to 66.3%, which is well above the long-term average of 53.7%. If current trends continue, the balance between supply and demand makes further home price gains likely.
December’s drop was driven mainly by fewer new listings in the GTA and Ottawa–the same markets most responsible for the decline in sales. Listings available for purchase are now running at a 12-year low. The number of housing markets with a shortage of listings is on the rise; should current trends persist, fewer available listings will likely increasingly weigh on sales activity.
With new listings having declined by more than sales, the national sales-to-new listings ratio further tightened to 66.9% in December 2019 – the highest reading since the spring of 2004. The long-term average for this measure of housing market balance is 53.7%. Price gains appear poised to accelerate in 2020.
Considering the degree and duration to which market balance readings are above or below their long-term averages is the best way of gauging whether local housing market conditions favour buyers or sellers. Market balance measures that are within one standard deviation of their long-term average are generally consistent with balanced market conditions.
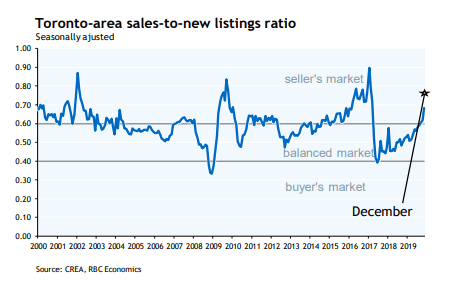
Based on a comparison of the sales-to-new listings ratio with the long-term average, just over half of all local markets were in balanced market territory in December 2019. That list still includes Greater Vancouver (GVA) but no longer consists of the GTA, where market balance favours sellers in purchase negotiations (see chart below). By contrast, an oversupply of homes relative to demand across much of Alberta and Saskatchewan means sales negotiations remain tilted in favour of buyers. Meanwhile, an ongoing shortage of homes available for purchase across most of Ontario, Quebec and the Maritime provinces means sellers there hold the upper hand in sales negotiations.
The number of months of inventory is another important measure of the balance between sales and the supply of listings. It represents how long it would take to liquidate current inventories at the current rate of sales activity. There were 4.2 months of inventory on a national basis at the end of December 2019 – the lowest level recorded since the summer of 2007. This measure of market balance has been falling further below its long-term average of 5.3 months. While still within balanced market territory, its current reading suggests that sales negotiations are becoming increasingly tilted in favour of sellers.
There remain significant and increasing disparities in housing market activity across regions of Canada. The number of months of inventory has swollen far beyond long-term averages in Prairie provinces and Newfoundland & Labrador, giving homebuyers ample choice in these regions. By contrast, the measure is running well below long-term averages in Ontario, Quebec and Maritime provinces, resulting in increased competition among buyers for listings and providing fertile ground for price gains. The measure is still within balanced market territory in British Columbia but is becoming increasingly tilted in favour of sellers.
Home Prices
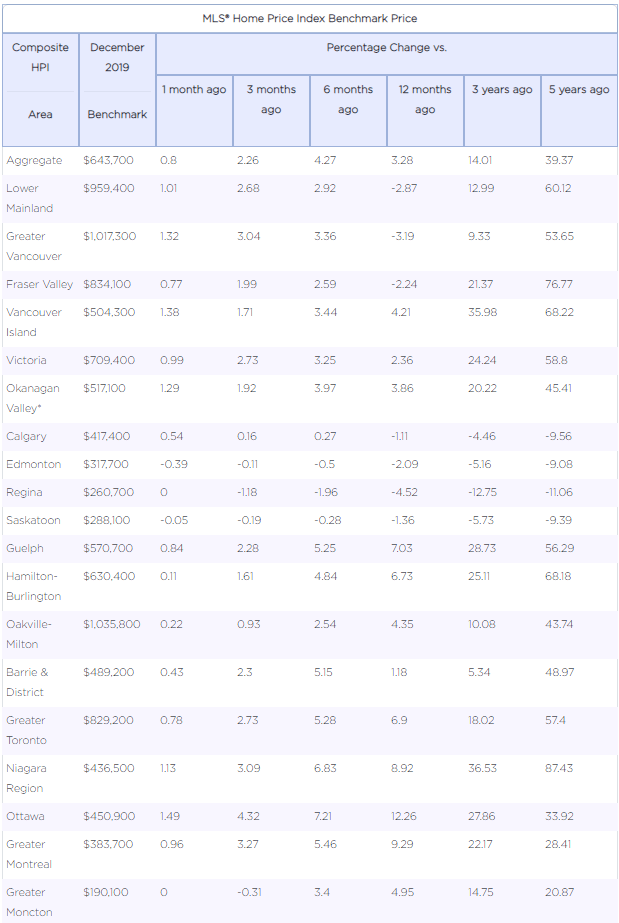
The Aggregate Composite MLS® Home Price Index (MLS® HPI) rose 0.8%, marking its seventh consecutive monthly gain. It is now up nationally 4.7% from last year’s lowest point posted in May. The MLS® HPI in December was up from the previous month in 14 of the 18 markets tracked by the index. ( see table below).
Home price trends have generally been stabilizing in the Prairies in recent months following lengthy declines but are clearly on the rise again in British Columbia and Ontario’s Greater Golden Horseshoe (GGH). Further east, price growth in Ottawa and Montreal has been ongoing for some time and strengthened toward the end of 2019.
Comparing home prices to year-ago levels yields considerable variations across the country, although for the most part has been regionally split along east/west lines, with declines in the Lower Mainland and major Prairie markets and gains in central and eastern Canada.
The actual (not seasonally adjusted) Aggregate Composite MLS® (HPI) rose 3.4% y-o-y in December 2019, the biggest year-over-year gain since March 2018.
Home prices in Greater Vancouver (-3.1%) and the Fraser Valley (-2%) remain below year-ago levels, but declines are shrinking. Elsewhere in British Columbia, home prices logged y-o-y increases in the Okanagan Valley (+4.2%), Victoria (+2.3%) and elsewhere on Vancouver Island (+4.2%).
Calgary, Edmonton and Saskatoon posted y-o-y price declines of around -1% to -2%, while the gap has widened to -4.6% in Regina.
In Ontario, home price growth has re-accelerated well above consumer price inflation across most of the GGH. Meanwhile, price gains in recent years have continued uninterrupted in Ottawa, Montreal and Moncton.
All benchmark home categories tracked by the index accelerated further into positive territory on a y-o-y basis. One-storey single-family home prices posted the most significant increase (3.6%) followed closely by apartment units (3.4%) and two-storey single-family homes (3.3%). Townhouse/row unit prices climbed a slightly more modest 2.7% compared to December 2018.
The actual (not seasonally adjusted) national average price for homes sold in December 2019 was around $517,000, up 9.6% from the same month the previous year.
The national average price is heavily skewed by sales in the GVA and GTA, two of Canada’s most active and expensive housing markets. Excluding these two markets from calculations cuts more than $117,000 from the national average price, trimming it to around $400,000 and reducing the y-o-y gain to 6.7%.
This article was written by Dr. Sherry Cooper, DLC's chief economist and was originally included in her regular newsletter published on Jan 15th 2020.