the right broker for you.
Contact Us

Contact Us
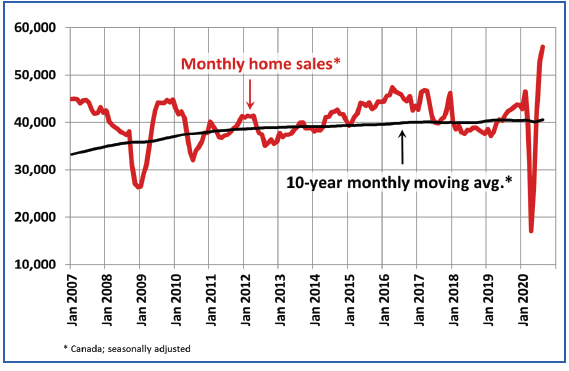
Another Record-Setting Month For Canadian Housing
Canadian Housing Market Sets Record Highs in August

New Listings
The number of newly listed homes posted a further 10.6% gain in August compared to July. New supply was up in close to three-quarters of local markets, led by gains in the Lower Mainland, GTA and Ottawa.
With the August increase in new supply outpacing the rise in sales for the first time since the rebound began in May, the national sales-to-new listings ratio eased to 69.4% in August compared to 72.3% posted in July. That said, it was still among the highest levels on record for this measure.
Based on a comparison of sales-to-new listings ratio with long-term averages, only about a third of all local markets were in balanced market territory, measured as being within one standard deviation of their long-term average. The other two-thirds of markets were above long-term norms, in many cases well above.
The number of months of inventory is another important measure of the balance between sales and the supply of listings. It represents how long it would take to liquidate current inventories at the current rate of sales activity.
There were just 2.6 months of inventory on a national basis at the end of August 2020 – the lowest reading on record for this measure. At the local market level, a number of Ontario markets are now into weeks of inventory rather than months. So supply constraints are still prevalent in many parts of the country, especially in Ontario.
Home Prices
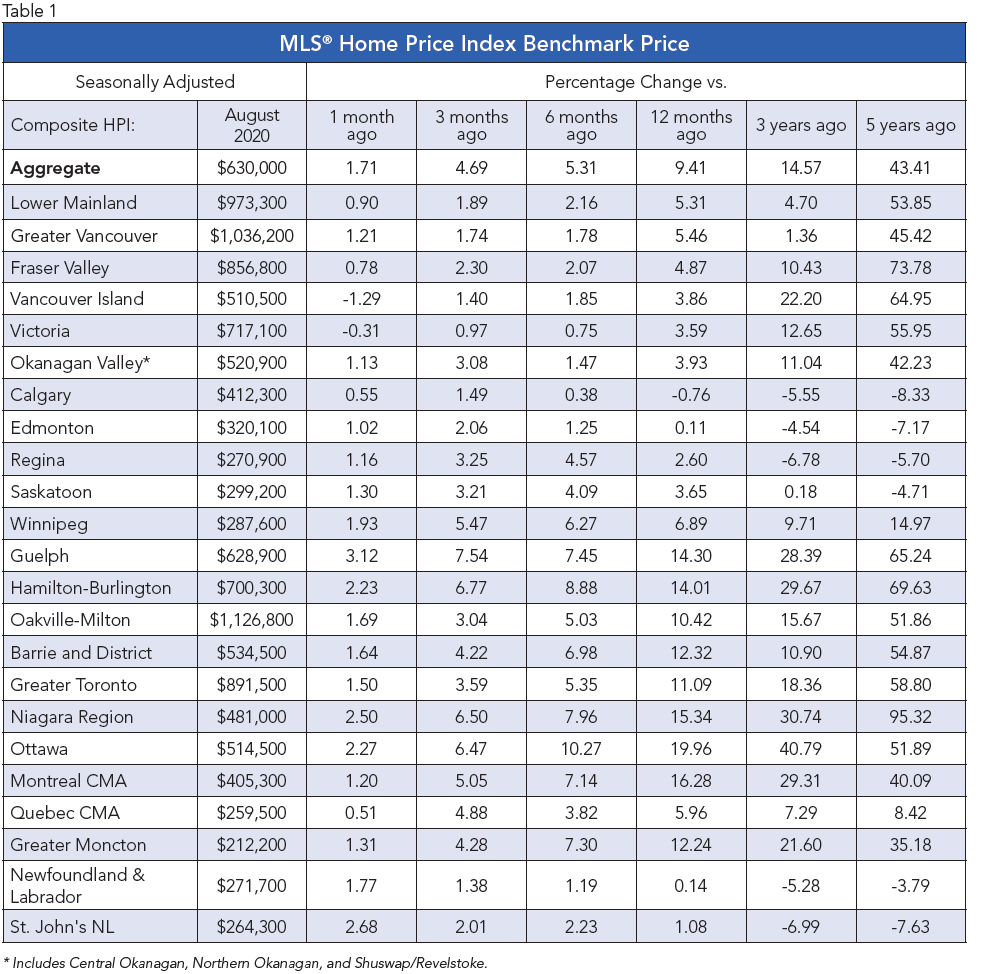
The Aggregate Composite MLS® Home Price Index (MLS® HPI) rose by 1.7% m-o-m in August 2020 (see chart and table below). This compares to a 2.3% m-o-m jump in July 2020 – the second largest increase on record (after March 2017) going back 15 years. Of the 21 markets currently tracked by the index, m-o-m gains were posted everywhere but Victoria and elsewhere on Vancouver Island.
The non-seasonally adjusted Aggregate Composite MLS® HPI was up 9.4% on a y-o-y basis in August – the biggest gain since late 2017.
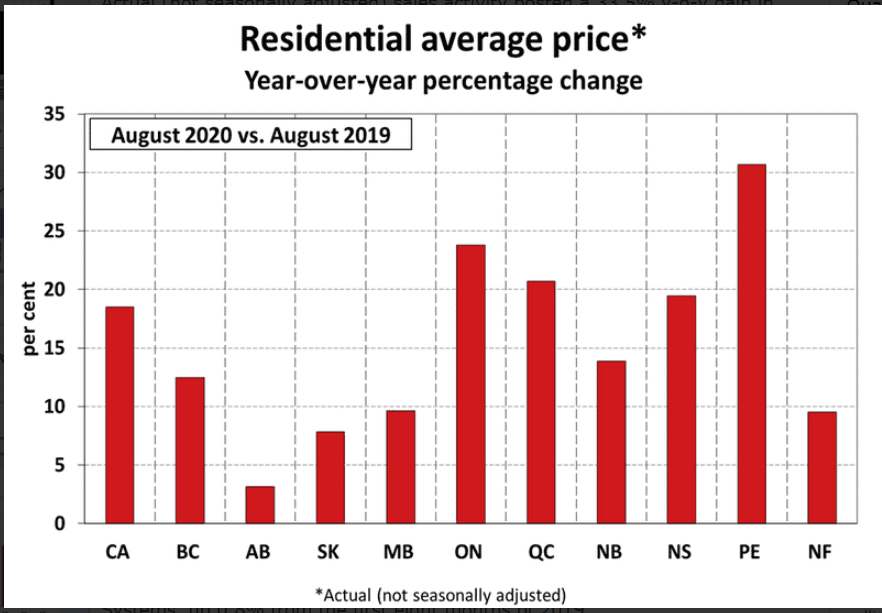
The largest y-o-y gains were recorded in Ottawa (+19.9%) and Montreal (+16.4%), followed by increases in the 10% - 15% range in the GTA and surrounding Greater Golden Horseshoe markets. Moncton prices were also up in that range in August.
Prices were fairly flat on a y-o-y basis in Calgary, Edmonton and St. John’s, while climbing in the 3.5% - 5.5% range across B.C.
The MLS® HPI provides the best way to gauge price trends because averages are strongly distorted by changes in the mix of sales activity from one month to the next.
The actual (not seasonally adjusted) national average home price set another record in August 2020 at more than $586,000, up 18.5% from the same month last year.
Bottom Line
CMHC forecasted back in May that the national average sales prices will fall 9%-to-18% in 2020 and not return to yearend-2019 levels until as late as 2022. Instead, the national average sales price as of August has posted a 18.5% gain.
Housing strength is largely attributable to pent-up demand by households that have maintained their level of income during the pandemic. The hardest-hit households are low-wage earners in the accommodation, food services, and travel sectors. These are the folks that can least afford it and typically are not homeowners.
The good news is that the housing market is contributing to the recovery in economic activity.
________________________________________________________________________
CMHC Annual Residential Mortgage Industry Report
The Residential Mortgage Industry report provides an in-depth view of the residential mortgage market in Canada: from mortgage origination to funding, covering insured and uninsured mortgages, and encompasses activity from all mortgage lender types. It is based on data available at the end of the second quarter of 2020. The following are key highlights:
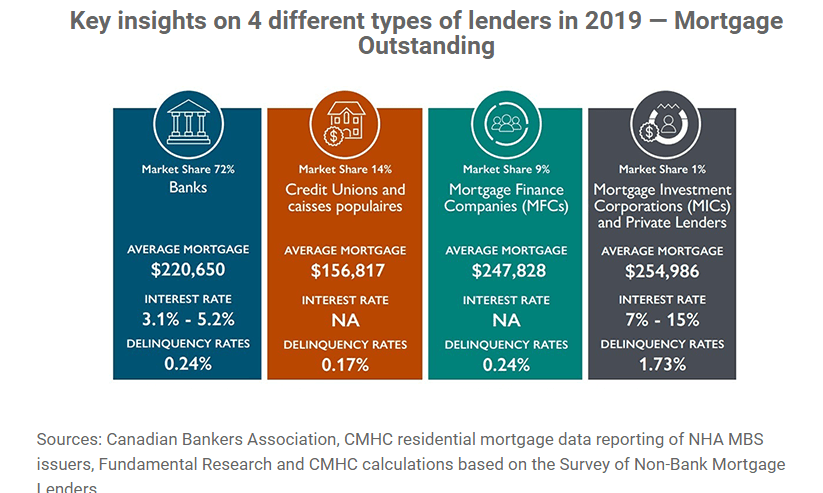
Mortgage lender type trends
- The report shows that in 2019, Canada’s big six banks maintained their strong foothold in the housing finance market, with a 67% market share of newly extended mortgages (see chart below).
- Mortgage Finance Companies (MFCs) hold 20% of the insured mortgage space and credit unions stand at 12%.
- Mortgage delinquencies of 90 days or more remained at low levels for all mortgage lender types, which suggests that a steady share of mortgage holders continued to be able to make their payments or were able to defer their mortgage payments.
- MICs continued to represent 1% in nationwide outstanding mortgages, valued at approximately between $14 billion and $15 billion in mortgage debt.
- Some MICs offered mortgage deferrals and other types of accommodations to financially strained mortgage consumers. An estimated 10% of mortgage consumers asked for a mortgage deferral.
- Mortgage Funding TrendsDeposits continued to be the primary source of mortgage funding for the big six banks (66%) and credit unions (77%).
- Covered bonds made up 17% of total mortgage funding for Canada’s big six banks at the end of the first quarter of 2020, representing an increase of 4% from 2019.
- Private securitization continued to account for a very small share of the mortgage funding mix in Canada, with just 1.1%. However, the residential mortgage-backed securities market appears to be expanding.
This article was written by Dr Sherry Cooper, DLC's Chief Economist and was published here with permission.


QUICK LINKS
HEAD OFFICE
FOLLOW US

Copyright © 2023 DLC Canadian Mortgage Experts. All Rights Reserved | Privacy & Content Policy